Genetic Info
Excerpt from the Ayrshire Review – April-May-June 2018 Edition
Let’s Talk About Genetics…
Ayrshire Canada believes it is important to inform their breeders on the subject of genetics. Beyond informing, we also wish to elicit thoughts and encourage discussions about sound, and generally recognized, genetic bases.
As is the case of your business, Ayrshire Canada must also ensure that its herd (the breed) remains on tracks and successfully meet the needs of the industry, while respecting its genetic realities. This supervision task is entrusted to the Breed Improvement Committee. You will understand that, to promote forward-thinking discussions, we must enable committee members to make informed decisions that leave little or no room for improvisation.
Last January, our discussions revolved in part around the breed’s phenotypic results for production and conformation. The following tables #1-2-4 were presented by Mr. Brian Van Doormaal, General Manager at the Canadian Dairy Network (CDN), as part of his lecture.
Table #1
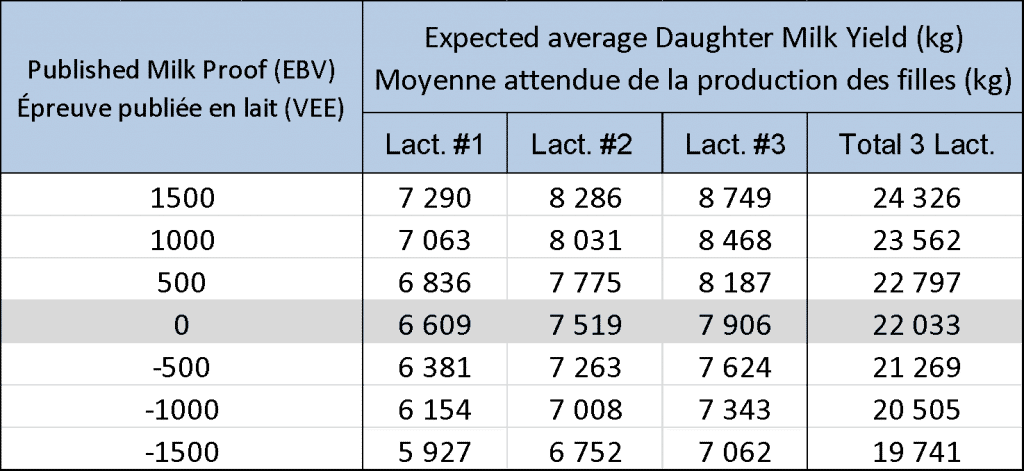
Table #1 shows the relationship between genetic indexes, expressed as Estimated Breeding Value (EBV), and potential cow productions. Daughters of a sire with a proof of +1,500 kg of milk will have a production potential of 24,326 kg in 3 lactations, compared to 19,741 kg for those of a sire with a milk proof of -1,500. This translates into a significant difference of 4,585 kg in 3 lactations, or a ±764 kg difference for every 500 kg of milk.
Table #2
Fat & Protein
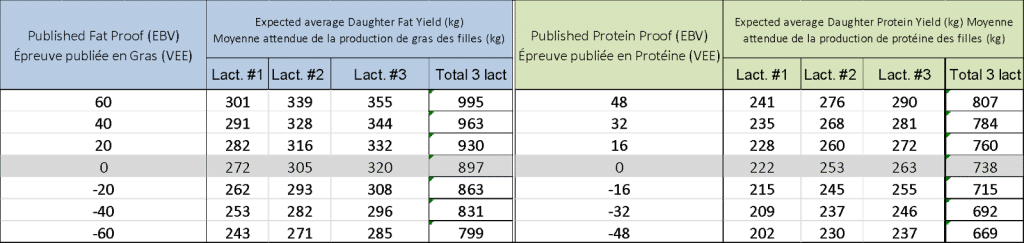
Table #2 shows potential productions of total solids. Daughters of a sire with a proof of +60 in fat and +48 in protein will have a production potential of 1,802 kg of solids (fat + protein) in 3 lactations. Meanwhile, daughters of a sire with a zero (0) kg EBV would produce a total of 1,635 kg of solids in 3 lactations, which would mean a difference of 98 kg less.
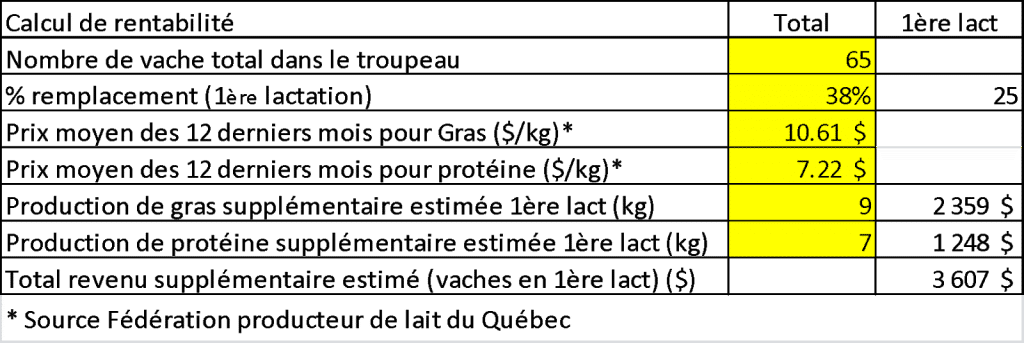
In a more realistic context, it would be more insightful to present the financial benefits as such. We must first consider that every 20 kg of EBV in fat and 16 kg of EBV in protein represents an additional production potential of ±9 kg of fat and ± 7kg of protein per lactation, regardless of the level of management. In the following example (table #3), based on the average price payed for fat and protein (12-month average: May 2017 to May 2018), potential additional revenues for cows in their 1st lactation would be $3,607 for a 65-cow herd.
Table #3
Herds that already have an above-breed average production will also experience a comparable production increase. This upward trend will repeat itself in every additional lactation. We could also say that production costs would be less, since more kilograms of solids would be produced per kg of feed served, kg/stall, kg/employee, etc….
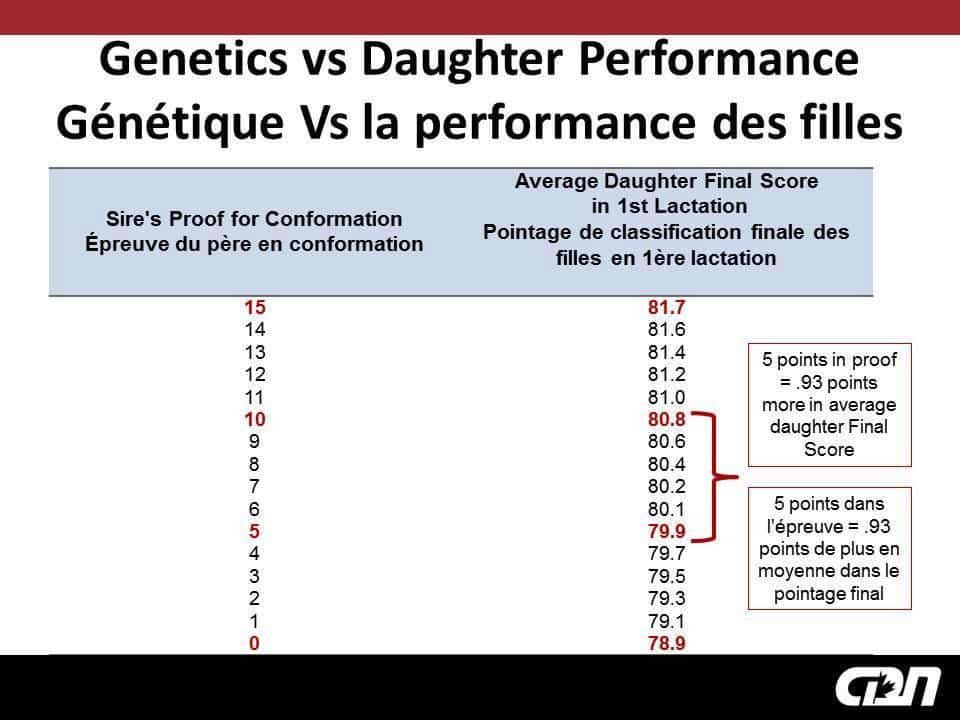
Table #4
Conformation
Table #4 shows that daughters of a sire with a conformation proof of +10 obtain a classification average of 80.8 points, compared to the 79.9 average given to daughters of a +5 sire. It is therefore a minimal difference of 0.9 point for every 5-point increment in conformation. Since longevity is influenced by conformation, we must always take it into account when crossbreeding. The aesthetic appearance remains very important in Canada; as such, it is difficult to ignore it… However, it would not be wise to reject any sire from a breeding program on the sole basis that it would have a great impact on the final classification result of the herd or the breed.
In conclusion, the level of management will greatly influence the phenotypic results of herds, or the breed. Selecting sires and females with higher genetic potential will generally give positive results, which will vary according to the level of herd management.